September 4, 2024
The Potential of SAF for Ethanol Producers
Since the beginning of aviation, there have been just two major fuel types.
- Aviation gasoline for use in smaller or older aircraft with spark-ignited internal combustion engines.
- Jet fuel for use in gas-turbine engines.
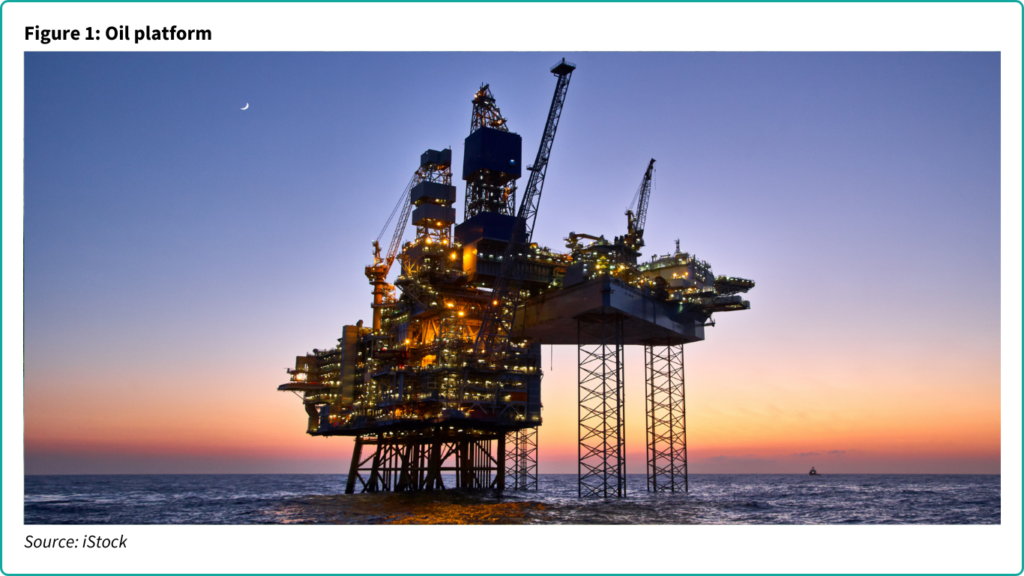
Both are made from distillation of crude oil.
But today the world is starting to use a third fuel type. Sustainable aviation fuel (SAF) made from non-fossil sources is set to become the dominant aviation fuel in the coming decades. Its growth is an enormous opportunity for agricultural processors around the world.
SAF usage will grow because it is currently the only viable way to decarbonise aviation. Ships can sail. Cars can be electrified. Neither option currently works for planes. Sails for obvious reasons. Batteries because they are heavy, not energy dense, have a limited range and can be prone to fires. For the foreseeable future aircraft will have to run on liquid transport fuels. Aviation accounts for around 3% of global carbon dioxide (CO2) emissions; if the world is serious about moving to net zero, SAF will be a major part of the story.

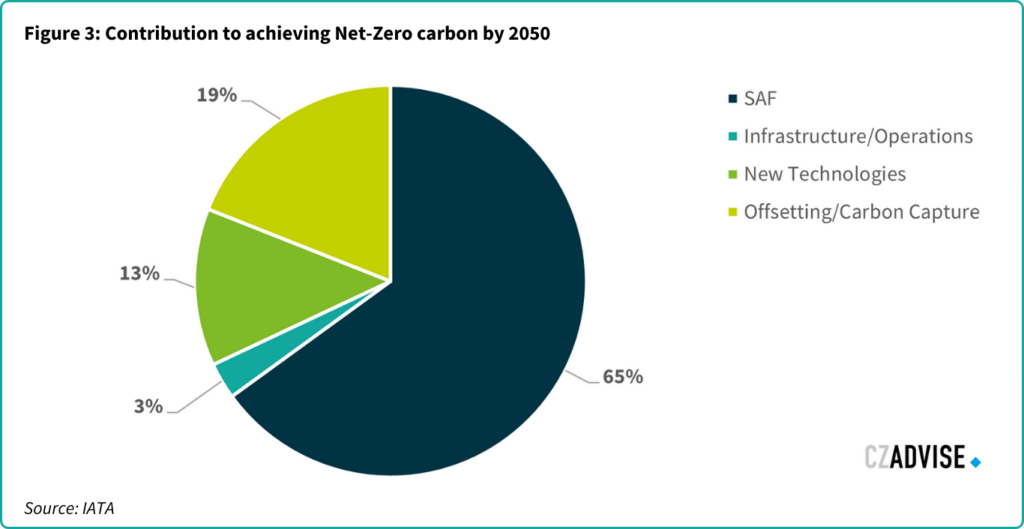
The aviation industry is serious about net zero. At the 77th International Air Transport Association (IATA) Annual General Meeting in 2021, airlines pledged to achieve net-zero CO2 emissions by 2050. Similarly, in 2022, member states of the International Civil Aviation Organisation (ICAO) adopted a long-term aspirational goal of net-zero CO2 emissions for the aviation sector by 2050.
IATA projects that SAF could account for approximately 65% of the emissions reductions necessary for the aviation industry to achieve net-zero by 2050. Achieving this will necessitate a significant boost in SAF production to satisfy demand.
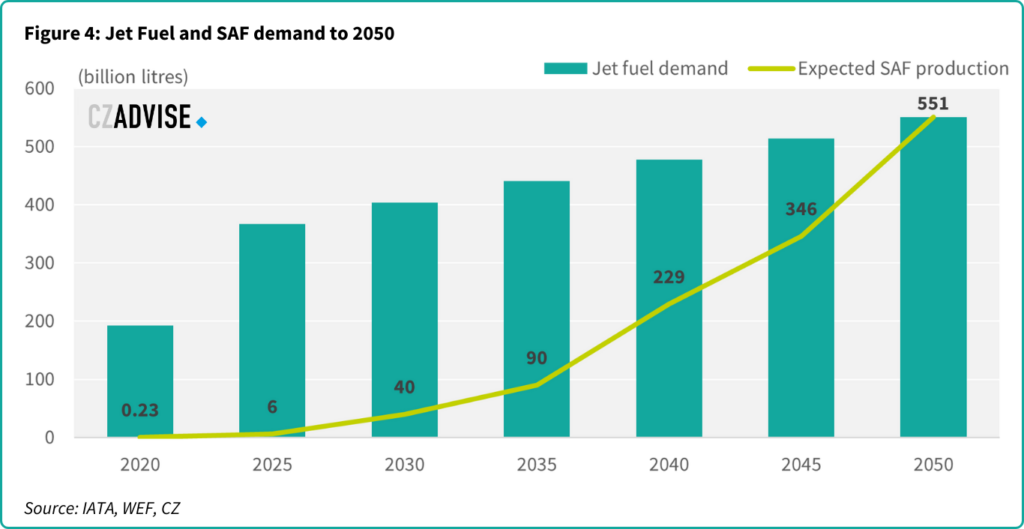
We think it’s possible that the world consumes 551b litres SAF by 2050, compared to 1.9b litres today. In this study we will explore how this might happen and what the demand for SAF feedstock means for ethanol producers.
Jet Fuel and SAF demand to 2050
The World Economic Forum (WEF) predicts that the demand for aviation fuel could increase by over 50% by 2050 compared to 2019 levels. Moreover, today SAF accounts for less than 1% of all aviation fuel used. Its growth will therefore need to be rapid, yet global production remains inadequate.
Currently, announced projects will only make 30-40% (12-16 billion litres) of the SAF required by 2030. This means new SAF production facilities will need to come on stream quickly in regions with favourable conditions.
Appropriate government regulations and policies will be needed to establish a viable SAF market, considering that SAF production costs are currently 2-5x higher than those of fossil jet fuel. The following table shows an overview of SAF-related policies being developed or already adopted globally.
Table 1: List of SAF related policies being developed or already adopted globally
| Adopted | ||
| North America | Canada | SAF Target of 1 billion litres by 2030 |
| USA | Renewable fuel standard | |
| Blender’s Tax Credit | ||
| State-level incentives | ||
| Increase SAF production to 11 billion litres by 2030 | ||
| South America | Brazil | SAF Mandate: 1% SAF in 2027 |
| Europe | UK | SAF Mandate 10% in 2030 |
| Denmark | Fossil-free inland flights in 2030 | |
| France | SAF Mandate: 5% by 2030 | |
| Spain | SAF Mandate: 2% by 2025 proposed | |
| Norway | SAF Mandate: 0.5% in 2020 considering 30% by 2030 | |
| Sweden | SAF Mandate: 30% SAF in 2030 | |
| Finland | SAF Mandate: Considering 30% by 2030 | |
| Rest of EU | ReFuel EU: 6% mandate by 2030 | |
| Asia | Japan | SAF Mandate: 10% by 2030 |
| Malaysia | SAF Mandate: 1% by 2026 (47% by 2050) | |
| Middle East | UAE | SAF Mandate: 610 million litres of SAF by 2030 |
| In development | ||
| South America | Chile | Flight Clean government programme |
| Europe | Turkey | SAF Mandate 5% proposed |
| Asia | India | SAF Mandate 5% by 2030 proposed |
| China | ETS Expansion to aviation expected 50kt SAF by 2025 | |
| Oceania | Australia | Jet Zero Council target: 10% SAF in 2030 |
| New Zealand | Sustainable biofuels mandate | |
1.1 Pathway split to 2050
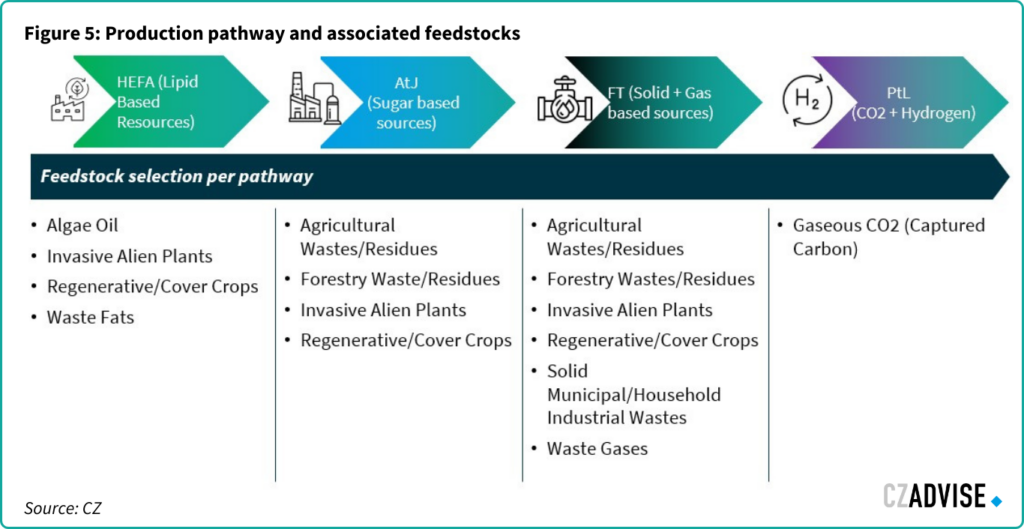
SAF can be made from several major pathways, each using different feedstocks. The choice of pathway depends on feedstock availability, sustainability objectives and production costs.
- Fats, Oils and Greases: Any source of fat, oil, or grease can be transformed into bio-oil, which can then be hydro-processed into SAF using HEFA (Hydroprocessed Esters and Fatty Acids) technology.
- Sugars: Any source of sugar can be converted into ethanol or iso-butanol, which can then be converted into SAF via AtJ (Alcohol-to-Jet) technology.
- Solid Biomass: Solid biomass such as biogenic municipal waste (including bioplastics) or forestry residues can be converted into a synthetic gas intermedia product. This product can subsequently be processed into SAF using FT (Fischer-Tropsch) technology.
- Renewable Energy: Renewable energy can be harnessed to produce hydrogen from water and capture carbon dioxide from the atmosphere or point emission sources. PtL (Power-to-Liquid) SAF can then be produced via the FT or AtJ processes.
Currently, around 85% of SAF is produced using the HEFA pathway with waste oils as feedstock. This is due to lower capital expenditure costs and the availability of feedstocks that closely match the energy density of fossil fuels.
However, most of the growth up to 2040 and beyond will come from pathways not widely used at scale today.
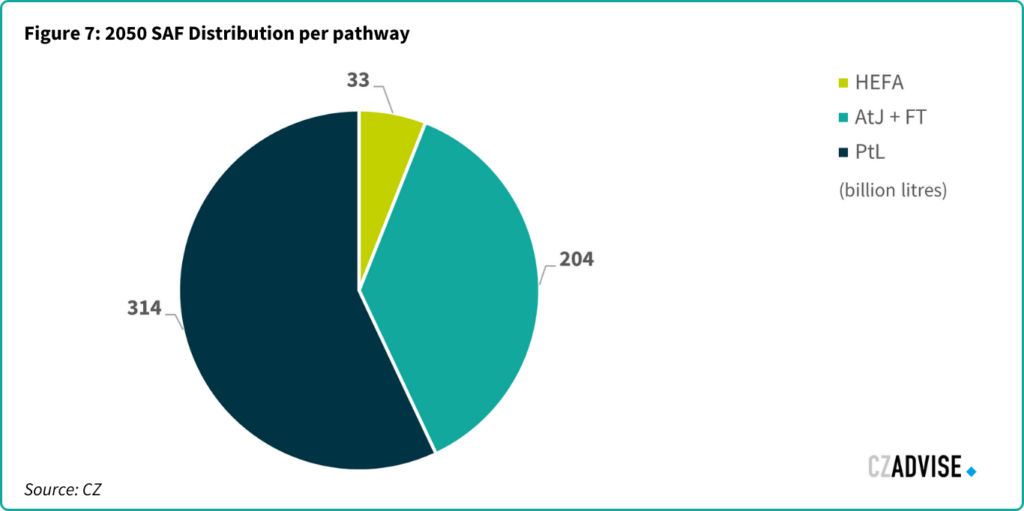
IATA anticipates that four SAF production pathways will play a crucial role in achieving net-zero emissions by 2050. Among these, they expect Power-to-Liquid (PtL) technology to be the most significant, contributing to 57% of global production. One small catch: this pathway is not yet mature and requires further research to make costs competitive and achieve the scale required.
In addition to PtL, IATA believes the Alcohol-to-Jet (AtJ) pathway and the Fischer-Tropsch (FT) process will also be major contributors, together accounting for 37% of global SAF production.
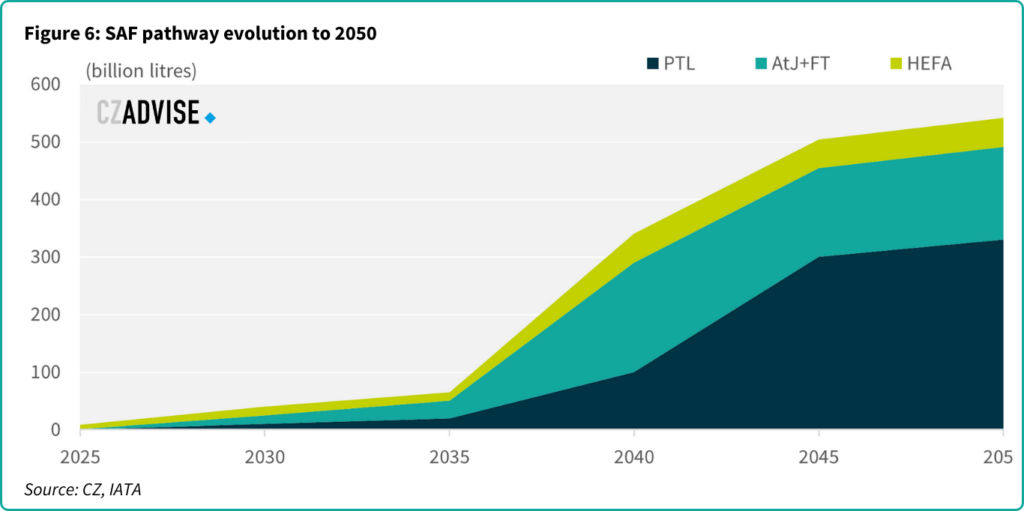
Given that PtL is still in its infancy we believe that the AtJ+FT pathway will capture a slightly bigger share of the SAF market at 204 b litres compared to IATA’s prediction of 161 b litres.
A detailed breakdown of the production capacity of the three leading production pathways for Sustainable Aviation Fuel (SAF) is presented below:
1.2 SAF Costs
Although SAF is more expensive than conventional kerosene today, we expect cost improvements across all SAF pathways in the coming decades. IATA have modelled the following cost projections.
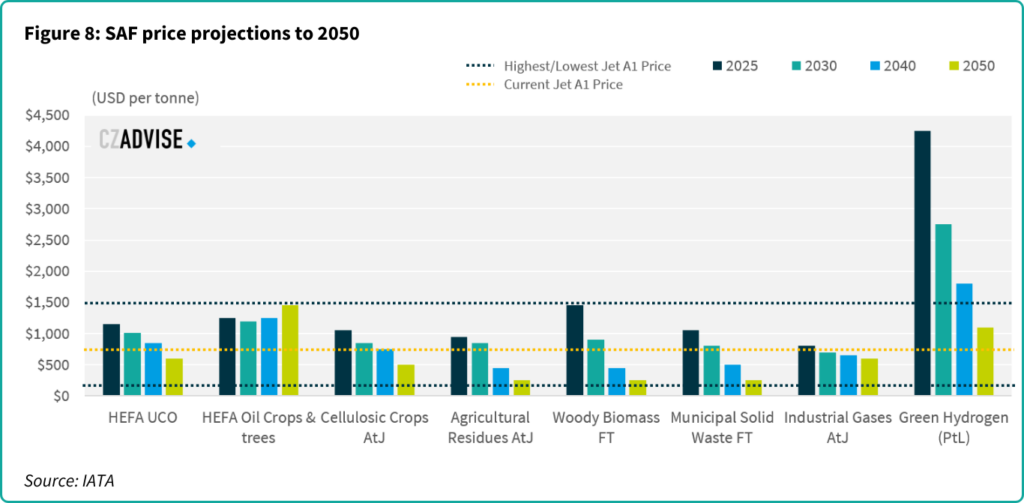
They forecast that AtJ could become cost competitive with jet fuel (assuming today’s price) as early as 2030. HEFA from used cooking oil (UCO) may become cost competitive in the 2040s. Meanwhile, IATA have modelled that PtL is unlikely to become cost competitive until at least 2050. This is a major problem for their assumption that PtL will become the dominant form of SAF by 2050. Either costs will need to fall faster than they have modelled, government incentives will be needed for decades to come or another more cost-effective pathway will need to dominate instead.
Regardless, it is clear SAF will need policy support in the years ahead. Addressing the following key cost drivers will be crucial:
- Feedstock cost and composition
- Capital cost and production process
- Overall yield (conversion efficiency)
- Quality and composition of the produced SAF
- Operating expenses
- Financial requirements
- Logistics
- Initial resources
The next table outlines the various elements that may influence the future costs of SAF, depending on different pathways and feedstocks. We’ve concentrated on feedstock availability and costs, and capital costs only for clarity.
Table 2: Breakdown of cost structure and challenges per SAF pathway
| Pathway Feedstock | Operational Cost | Capital Cost | Comments |
| HEFA: Waste Fat/Oils/Greases | High Constrained feedstock | Low Existing renewable fuel production capacity | Incentive policies are essential to lower operational costs tied to high feedstock expenses. |
| Alcohol-to-Jet + FT: Agriculture & Forestry Wastes | Low/Medium Abundant waste-based feedstock; low value | High New renewable fuel production capacity required | Risk capital is needed to support new biorefining ventures. Once the initial capital costs are covered, production costs will benefit from reduced feedstock expenses. |
| Fischer-Tropsch: Agriculture & Municipal Solid Waste (MSW) | Low/Medium Abundant waste-based feedstock; low value | High New renewable fuel production capacity required | In addition to above, higher tipping fee for waste collection can serve as an additional incentive to utilise these feedstocks. |
| Power-to-Liquid: Industrial Waste CO2 | Low/Medium Abundant synthetic carbon source from existing processes | High New renewable fuel production capacity required | A concentrated CO2 source is necessary for synthetic carbon production, but there are concerns about using fossil-origin CO2 for SAF production. |
| Power-to-Liquid Direct Air Capture CO2 | High Abundant synthetic carbon source, but required further technological maturing | Very High New renewable fuel production capacity required | The most abundant source of synthetic carbon but limited today by current technology immaturity; significant high capital intensity and renewable energy requirements. |
1.3 Production split scenarios
Given the pathways listed above and their possible costs in the future, we have modelled demand scenarios to 2050. Our initial three scenarios assume that IATA’s forecast of AtJ/FT accounting for 37% of global SAF production by 2050 is correct:
Scenario 1: This scenario reflects current global trends. The AtJ pathway becomes more commercially viable due to better overall feedstock availability compared to the FT process.
Scenario 2: This scenario is based on the hypothesis that the Fischer-Tropsch process will undergo more aggressive development and technological advancements, surpassing AtJ in terms of efficiency and cost-effectiveness.
Scenario 3: This is an aspirational scenario where both the AtJ and Fischer-Tropsch pathways achieve equal production capacities. This balance would lead to a more diversified and resilient energy portfolio, both in terms of feedstock inputs and geographic distribution ofproduction.
Table 3: 2050 SAF Split Scenarios
| 2050 SAF Split Scenarios | AtJ % | AtJ (billion litres) | Fischer Tropsch % | FT (billion litres) |
| Scenario 1 Pushing existing operations/expectations and technology | 70% | 143 | 30% | 61 |
| Scenario 2 Aggressive development | 60% | 122 | 40% | 82 |
| Scenario 3 Aspirational implementation | 50% | 102 | 50% | 102 |
The three scenarios outlined above provide us with a framework to project total global ethanol requirements for SAF production by 2050. These projections are illustrated in the chart below, highlighting the varying demands based on the different pathways and their development:
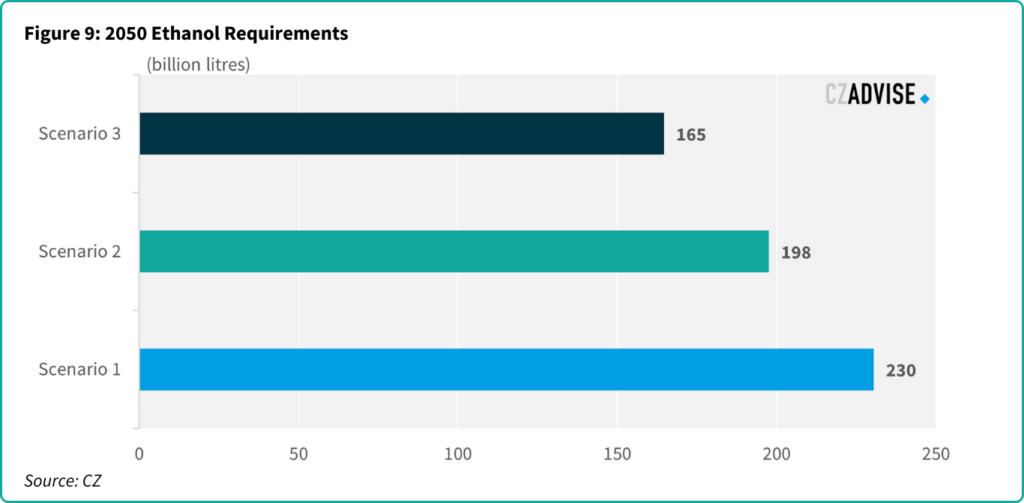
1.4 The implication for global ethanol production
Even in our lowest case scenario, where AtJ accounts for 50% of the AtJ/FT SAF production, which is itself just 37% of 2050 SAF output, more ethanol is required as a feedstock than is currently made around the world.
Table 4: Top 10 ethanol producers
| Global ethanol production 2023 | Billion litres |
| United States | 59.1 |
| Brazil | 31.3 |
| EU | 5.5 |
| India | 5.4 |
| China | 3.6 |
| Canada | 1.7 |
| Thailand | 1.4 |
| Argentina | 1.1 |
| Rest of World | 2.9 |
| Total | 112.0 |
Our lowest scenario indicates 165 billion litres of ethanol will be required for SAF production each year. In 2023, global ethanol production reached just 112 billion litres, with 80% of that output coming from the U.S. and Brazil.
It is also possible that this forecast is too low, given that Power-to-Liquid (PtL) technology, which IATA expects to account for 57% (314 billion litres) of SAF production by 2050 is still an unproven technology on an industrial scale.
If PtL production estimates do not materialise, the shortfall will need to be compensated by other production pathways, with Alcohol-to-Jet (AtJ) being the most likely option. Based on our estimates, for every 10% shortfall in PtL output (31.4 billion litres), an additional 50.7 billion litres of ethanol will be required to meet the deficit.
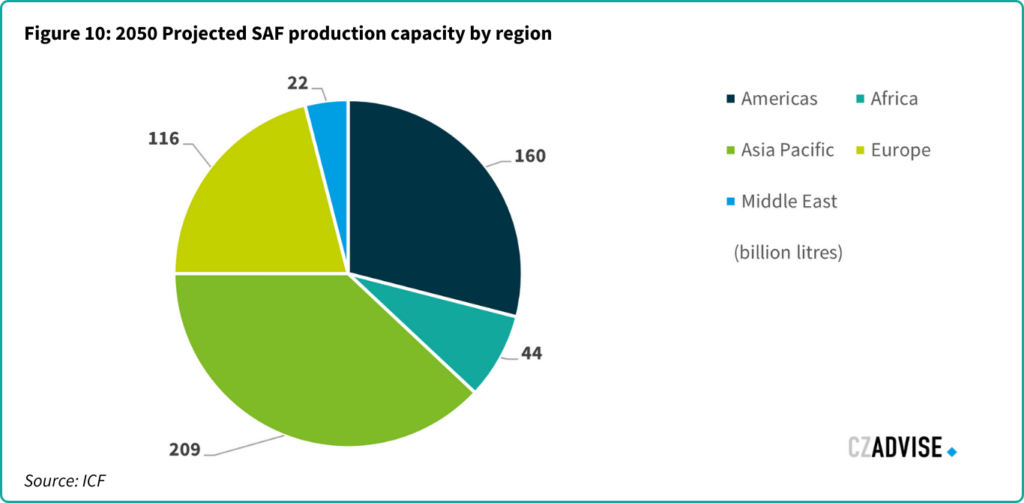
1.5 Regional feedstock requirements
If more than 80% of the world’s current ethanol production already comes from the Americas, then this gives a clue as to where much of the world’s future AtJ feedstocks could originate from. We expect the Americas to rank second in Sustainable Aviation Fuel (SAF) production capacity by 2050, behind only Asia-Pacific, which we expect to be the dominant region for jet fuel demand.
The Americas has a substantial amount of AtJ feedstock, which could significantly contribute to SAF production in other regions.
Brazil is the largest producer of ethanol in Latin America and the second largest in the world. It seems likely that much of the AtJ feedstock could come from Brazil, which is home to large cane and corn-based ethanol industries. The country is already one of the main suppliers of ethanol for SAF production in the US.
Under current US SAF rules, corn ethanol does not qualify for the government tax credit because its carbon savings are not sufficiently high. Corn ethanol will only reach the required level with no-tillage farming or carbon capture and storage. This is one reason why there is a consortium trying to build a CO2 pipeline across the Midwest, to link ethanol plants with sites capable of sequestering CO2. According to our research, this may end up pushing the US AtJ SAF industry towards Brazilian cane ethanol unless the SAF tax credit rules are changed.
If we assume Brazil contributes the full 165 billion litres of ethanol required for the global roll-out of AtJ SAF, its ethanol output would need to grow by 5.3 times over the next 26 years. Clearly not all of the ethanol feedstock will come from Brazil, but much of it will and the scaling required indicates the size of the challenge to decarbonise aviation.
While sugarcane is a key feedstock for ethanol production due to its favourable CO2 emission profile, particularly when compared to corn ethanol, it is not guaranteed that all the additional ethanol needed will come from sugarcane alone. Should ethanol production continue to rely heavily on sugarcane, it could necessitate up to 2.4 billion tonnes of sugarcane based on existing conversion rates.
Brazil produced 705 million metric tonnes of sugarcane in 2023, so achieving the projected ethanol output could require increasing sugarcane production by 3.3 times the current level. This increase will necessitate expanding the existing land area for sugarcane cultivation by 28.9 million hectares from the existing 9.5 million hectares.
Table 5: Future demand assumptions in Brazil
| Future demand assumptions | |
| Total ethanol to meet 2050 net-zero targets | 165 billion litres |
| Total sugarcane required to meet ethanol requirements for SAF production | 2.4 billion tonnes |
| Total hectares required for sugarcane feedstock | 28.9 million hectares |
Other favourable regions for SAF production
The most crucial factor for the location of SAF production is the availability of affordable local green energy such as electricity and heat. Additionally, the availability and cost of local feedstocks (e.g., types and quantities) are for considerations when assessing the appropriate location for a SAF production site. Ultimately, it is more efficient from both cost and carbon emissions perspectives to ship a finished product like SAF globally. It’s more energy-dense and so requires less shipping volume compared to feedstocks and generates lower carbon emissions across the entire supply chain.
Taking these factors into account, we have identified 17 key regions around the world that could be well-suited for scaling local SAF production by 2030. Many of the ideal production sites are in South America, Europe, SE Asia and Australia. We expect that surplus production from these regions will be available for export.
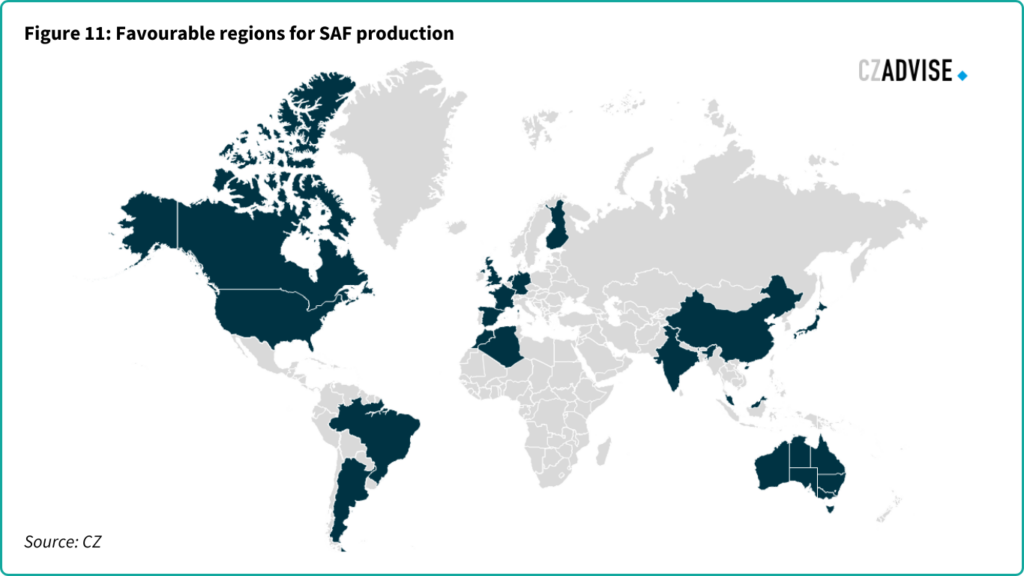
These factors are likely to lead to the establishment of international green SAF corridors, linking production hubs with demand centres worldwide.
The scale and challenges of SAF production for Brazilian Agri-Processors
The scale of SAF production required by 2050 is huge. It brings challenges for the agri sector to overcome.
3.1 Agricultural Production and Processing
Brazilian agri-processors are often smaller and more dispersed than the centralised oil majors. Partnerships between agricultural and energy companies are helping to bridge the gap between traditional agricultural practices and the new demands of sustainable fuel production. Shell’s partnership with Raízen, one of Brazil’s largest sugarcane processors, is an example of a successful collaboration between oil and agri-processors. Similarly, BP’s acquisition of Bunge’s stake in BP Bunge Bioenergia has further consolidated efforts in bioenergy production, providing the infrastructure and resources necessary to scale ethanol and SAF production.
These partnerships demonstrate the potential for synergies between agriculture and energy sectors, allowing smaller agri-processors to leverage the expertise, technology, of larger energy companies to enter a growing SAF market.
3.2 Unique Challenges for Agri-Processors
Resource Allocation: Farmers and agri-processors may need to allocate significant portions of their land and resources to growing feedstocks for SAF. This will require a major shift in land use which could be driven by prices, government mandates, and incentives.
Unlike other ethanol producers, Brazil’s ability to expand its cultivated area is relatively unconstrained. From 2004 to 2014, Brazil more than doubled its sugarcane area from 3.8m ha to 7.8m ha. We think sugarcane area reached 7.5m ha in 2024. We estimate that 30m ha (four times the current sugarcane area) of additional land are available for crop expansion.
Infrastructure and Investment: Unlike the established infrastructure for fossil fuels, the SAF production chain requires new facilities and technologies. This includes biorefineries capable of converting ethanol into fuel, which involves high initial investments and ongoing operational costs.
Beyond production, transporting SAF from biorefineries to airports is another logistical challenge. This could require either building new pipelines or relying on truck transport, each with its own set of infrastructure and cost considerations.
When market conditions within Brazil offer higher returns for SAF production, it will be advantageous for production plants to be in or near São Paulo state, allowing ethanol to be easily transported via existing infrastructure from the sugarcane-producing regions to SAF demand sites.
Regulatory and Market Dynamics: Navigating regulatory frameworks and market dynamics adds another layer of complexity. Agri-processors must adhere to sustainability criteria, certification processes, and changing policy incentives that can impact the viability of SAF production.
This is where programs like VIVE come into play. VIVE, a sustainability initiative led by CZ (Vive Programme), focuses on continuous improvement across entire supply chains, promoting transparency, traceability, and reduced carbon emissions. Through targeted modules and data-driven interventions, VIVE helps agri-processors meet sustainability goals while providing commercial benefits by creating a more efficient, low-carbon supply chain. As policies evolve, programs like VIVE offer agri-processors a framework to align with stringent environmental standards and maintain competitiveness in the SAF market.
3.3 Embracing the Opportunity
Despite these challenges, SAF can become a new revenue stream for Brazilian agri-processors.
Table 6: 2050 AtJ Market Size projection
| 2050 AtJ Market Size Projection | |
| IATA AtJ Projected SAF cost by 2050 | $500 USD/tonne |
| Minimum projected AtJ demand by 2050 | 102 billion litres |
| Estimated total market size | $41.6 billion USD |
The potential benefits for agri-processors include:
- Diversification of income: By producing SAF, agri-processors can diversify their income sources beyond traditional agricultural products.
- Utilisation of biomass: Biomass, which is often underutilised, can be converted into valuable feedstock for SAF production.
- Economic development: The development of a SAF industry can stimulate economic growth in rural areas.
- Environmental stewardship: By participating in SAF production, agri-processors can enhance their environmental credentials.
Cost projections to 2050
While current jet fuel production is centralised in massive refineries, most SAF production will be small and decentralised, with facilities situated close to feedstock sources. This change is similar to the shift in the electricity sector from centralised fossil fuel plants to distributed wind, solar, and hydro installations.
Fossil fuel refineries benefit from economies of scale in refining and logistics, while sustainable fuel facilities will be tailored to handle diverse and costly-to-transport feedstocks. Renewable fuel plants also require more feedstock to produce the same amount of fuel. In conventional refineries, the weight of the produced fuels is close to the weight of the crude input (and even higher in volume due to processing gains), but the mass yield for renewable fuels is much lower: 90% for converting lipids to fuels and 20% for municipal solid waste (MSW). Therefore, up to 5 tonnes of feedstock might be needed to produce one tonne of fuel, making feedstock logistics and costs critical.
Substantial investment will be needed to build these facilities. Consultants ICF estimate the bill could be between $1.08 to $1.45 trillion USD to develop sufficient SAF capacity. To put this into context, the average annual capital expenditure in the global oil and gas industry is around $770 billion. Companies like BP and Total have pledged to invest over 15% of their total capital budgets in transition investments, including renewables and biofuels. This investment will be enhanced by significant additional capital from emerging producers with specialised expertise in biofuel production technologies.
Table 7: SAF Investment requirements
| Investment Requirement | Global Deployment | Africa | Asia & Pacific | Europe | LATAM & Caribbean | Middle East | North America |
| SAF Deployment | $1.45 Trillion | $101 Billion | $554 Billion | $306 Billion | $183 Billion | $55 Billion | $252 Billion |
The financial outlook differs by production method: HEFA facilities require relatively lower capital investment but higher feedstock costs, whereas FT and AtJ facilities are more complex, using cheaper feedstocks but incurring higher initial capital costs and lower ongoing feedstock expenses. As these technologies advance, cost reductions will be realised, decreasing the investment needed for a given capacity. Repurposing outdated or unused assets could further lower the required investment.
Corporate advisers in agricultural and energy production
CZ Advise provides tailored consulting and corporate finance for agri-business and bioenergy supply chains.
Our consulting teams operate globally and offer a wide range of strategic advisory services to help companies successfully navigate the bioenergy sector. We specialise in market scoping, offering insights into emerging trends and opportunities across regions, as well as detailed cost analysis to help clients optimise operational efficiency and profitability. Additionally, we provide feedstock availability assessments and feasibility studies, ensuring that projects are not only economically viable but also sustainable in the long term. Our expertise in risk management and international partnerships enables us to help clients mitigate uncertainties while expanding into new markets with confidence.
James Brittain
Director, Head of Advisory
Stephen Geldart
Associate Director, Head of Analysis
CZ Advise is the largest agri-focused financial advisor in Brazil and Southeast Asia and has advised on over USD 5.4 billion in debt and equity transactions, assisting companies in securing the financial backing they need for growth and innovation. Our corporate finance expertise spans fundraising, capital structuring, mergers and acquisitions, and project financing, ensuring that our clients have access to the best possible funding solutions to scale their operations in a competitive global market.
CZ’s physical trading teams can also assist with food procurement, shipment and stock management. As well as ensuring continued prompt supply and storage of foods, we can also provide stock visibility as part of our service, increasing transparency in the food supply chain.
Luis Felipe Trinidade
Associate Director, Global Head of Corporate Finance
CZ’s trading teams can assist with the procurement, shipment, and stock management of ethanol and biomass, ensuring reliable supply chains for our clients. We also support ongoing feedstock visibility and storage solutions, enhancing transparency across the supply chain and helping businesses stay resilient in the face of fluctuating market conditions.
Get in touch with us to schedule a consultation.